This is what we do
FAQ

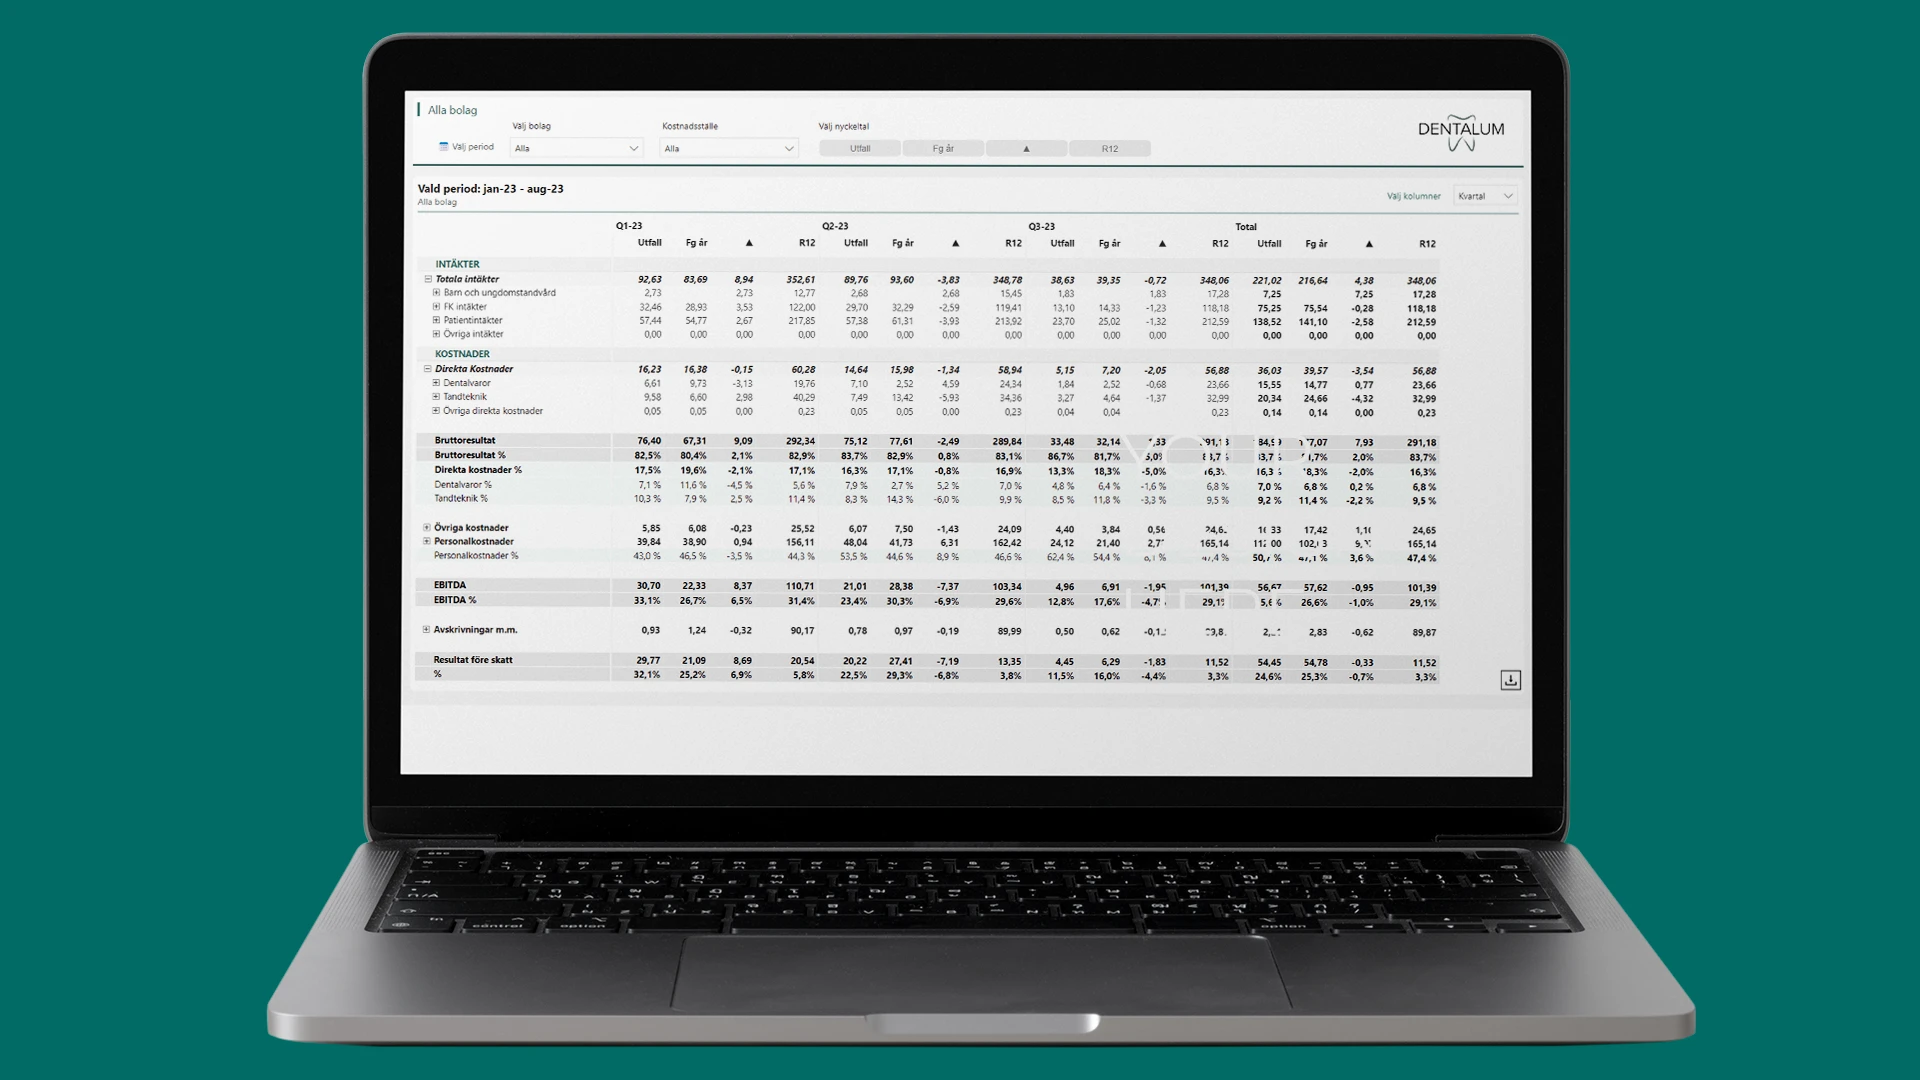
Almi needed a more dynamic and visual way to manage project and risk data. We created an interactive impact & probability matrix in Power BI - a tool that makes it possible to analyze, filter and discuss risks directly in real time.
"... when you saw the strength of the visualization of the risks, you just want more... and the discussions are conducted with the right focus..."
Almi is a state-owned organization that offers loans, venture capital and business development for companies with growth potential. Through advice and financing, Almi supports entrepreneurs in all industries and stages of development. The company actively contributes to innovation and business development by strengthening the competitiveness of Swedish companies.
Finance and Professional Services
1000
In project management, it is common to work with risk matrices in Excel, where probability and impact are plotted against each other. But for Almi, which managed many projects in parallel, it was difficult to get a clear and updated overall picture.
The goal was to move risk management to Power BI - where data could be updated automatically and users could interact with the information. The challenge? Power BI lacked a ready-made visualization for risk matrices.
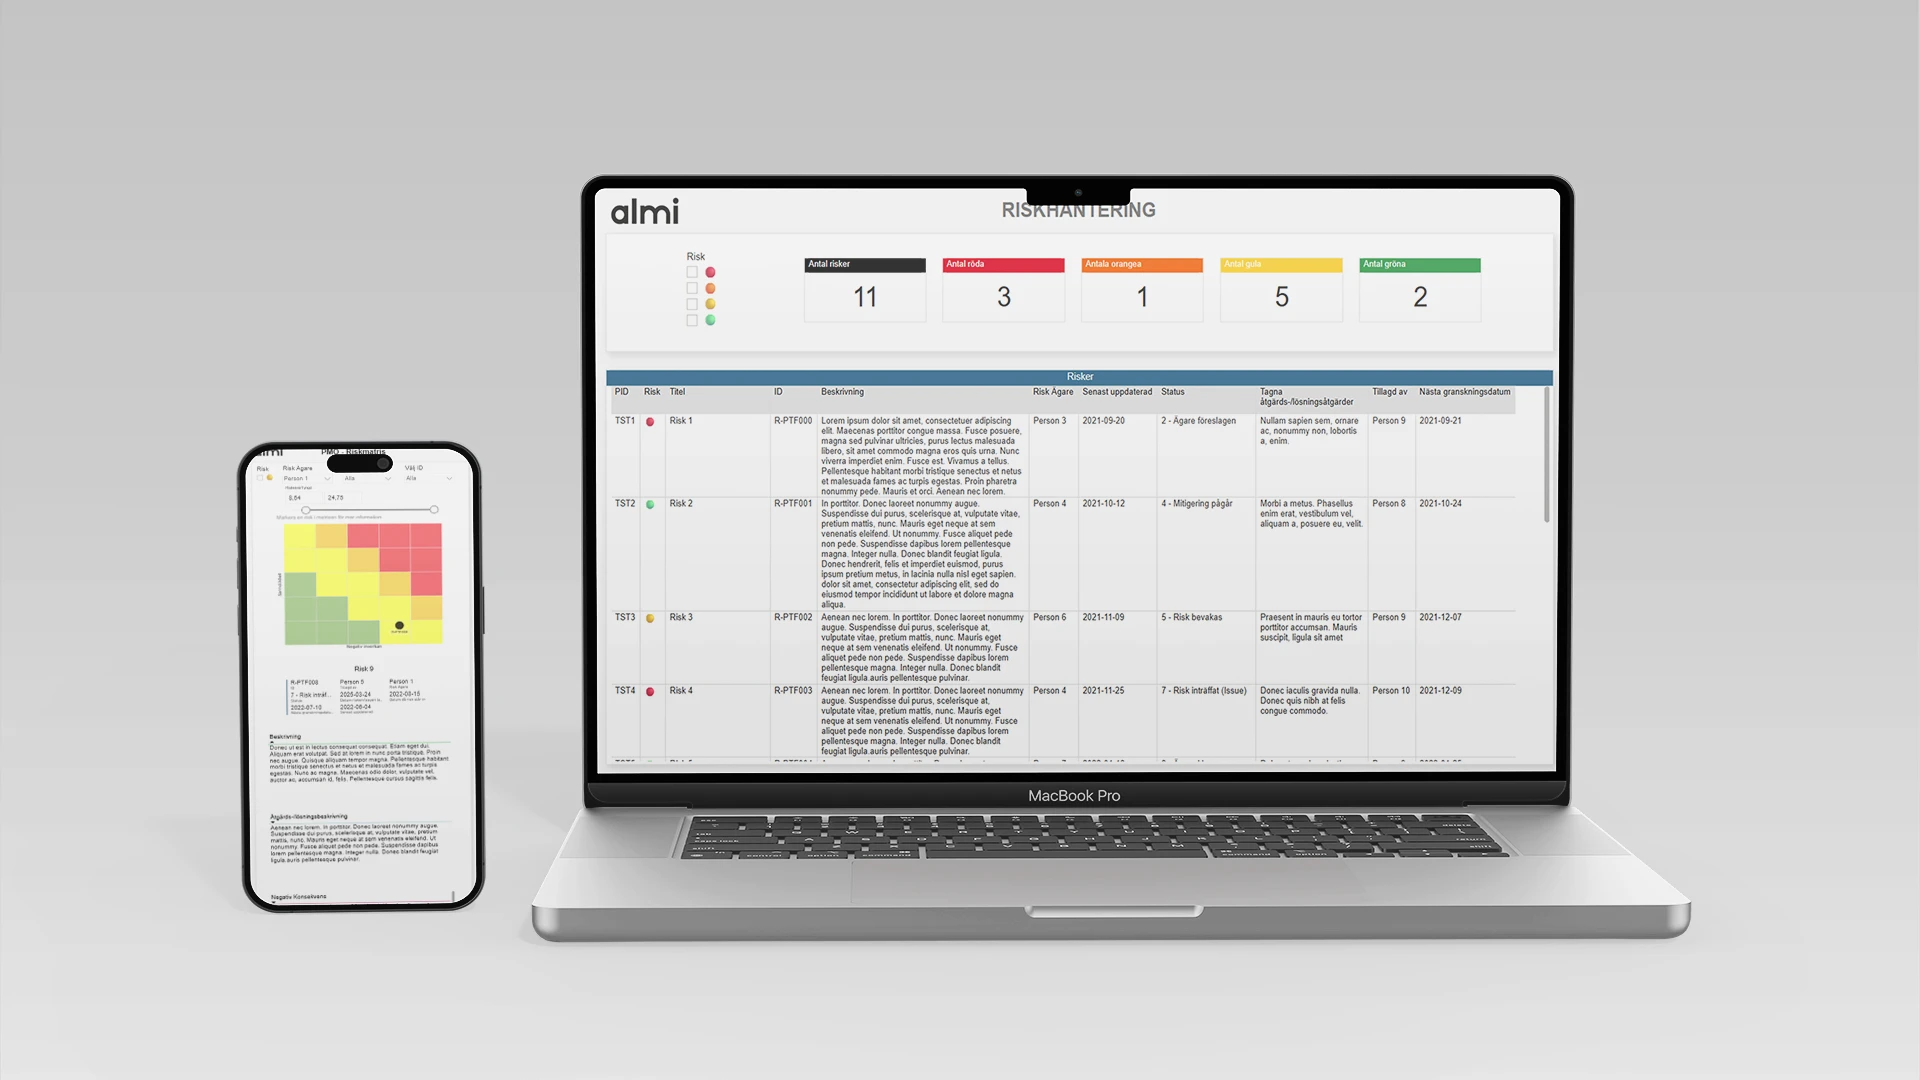
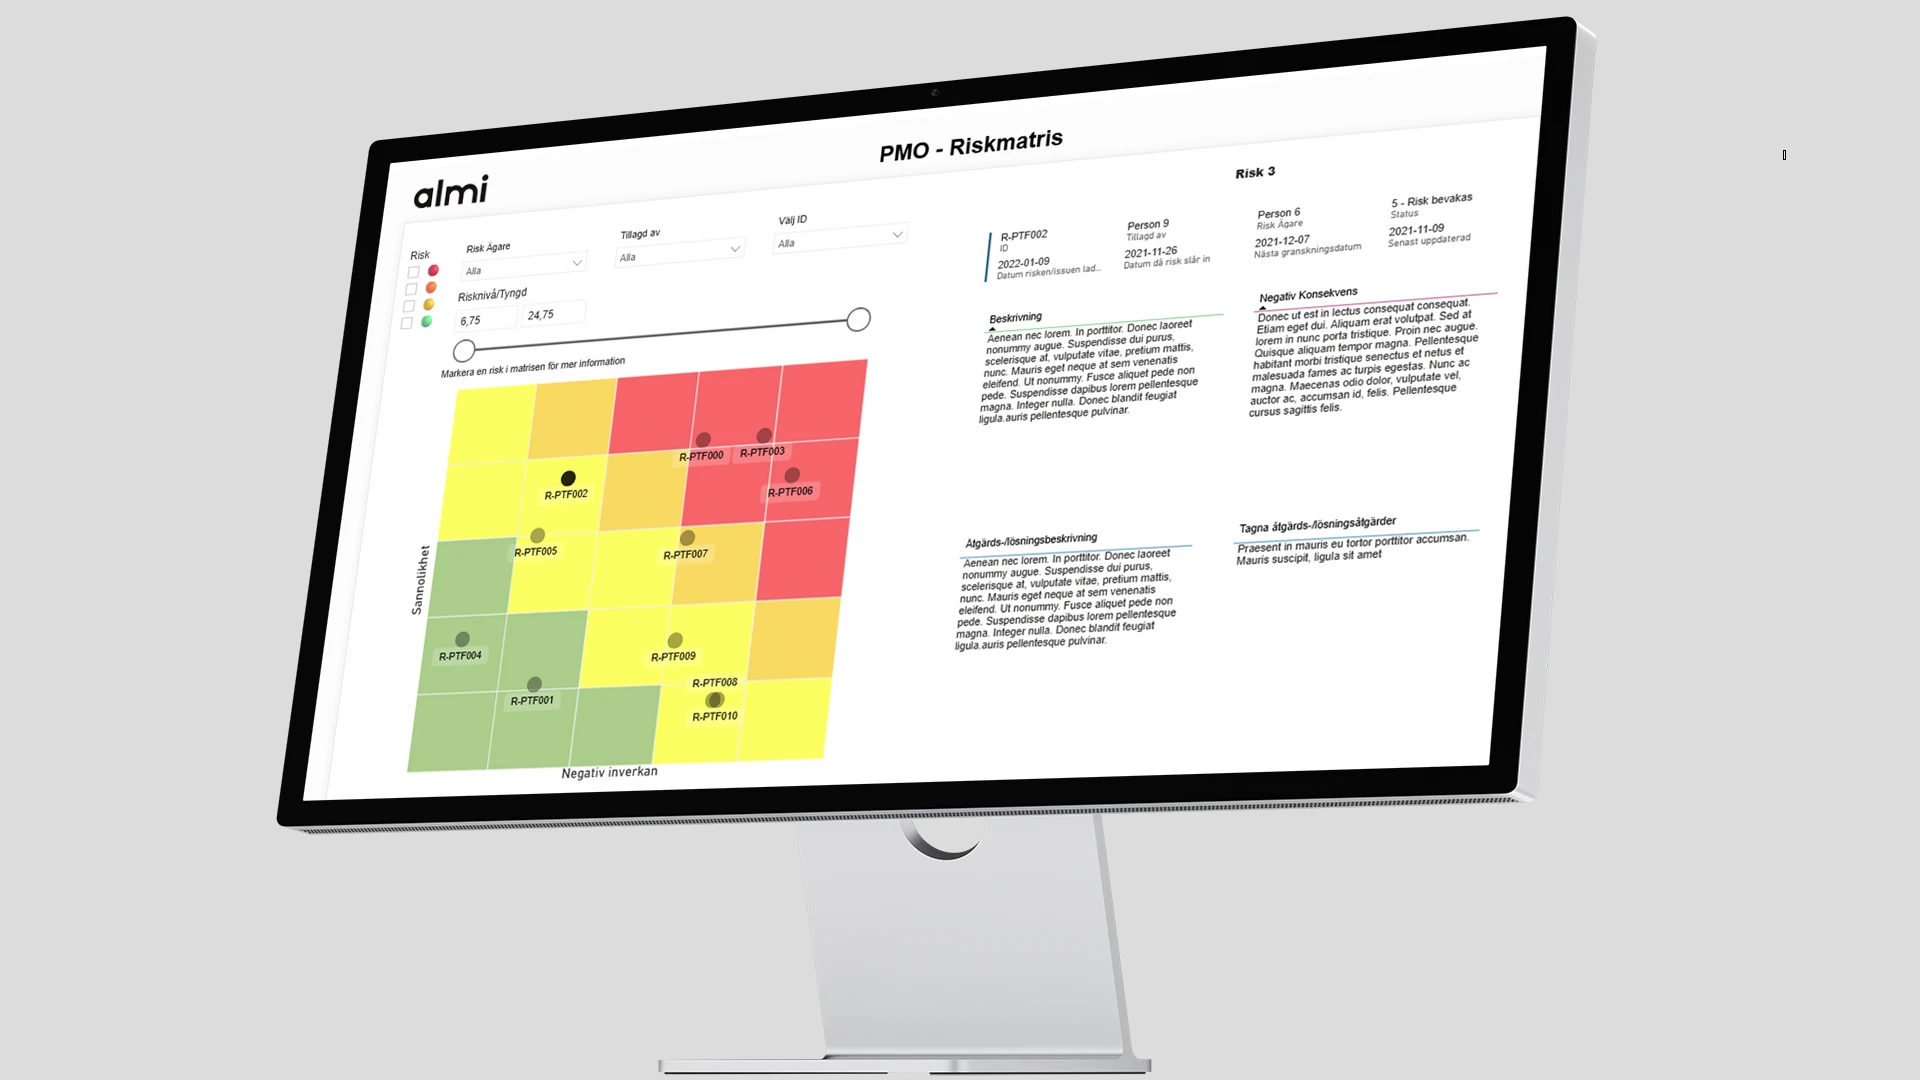
Rehngruppen built its own risk matrix by combining the Scatter chart with customized graphical elements. The data model was linked to source data that project managers update directly in Teams, keeping risk information current and accurate. The result was a solution where data is automatically cleaned, structured and visualized - without any manual handling.


When Almi's project managers saw the power of visualization, they just wanted more. The risk matrix is now used by both project managers and group management to analyze and discuss risks with the right focus. Thanks to filtering options and interactive functionality, users can quickly get an overview, follow developments over time and make informed decisions based on current data.