
This is what we do
FAQ

Financial reporting often requires short lead times, quick decisions and automation to run smoothly. We help you create interim and annual reports directly in Excel, Word and PowerPoint.

Developments in financial reporting have accelerated in recent years. The world around us and the current economic situation are creating entirely new needs - which in turn are driving smart innovation. Here is a brief overview of the main trends in financial reporting.
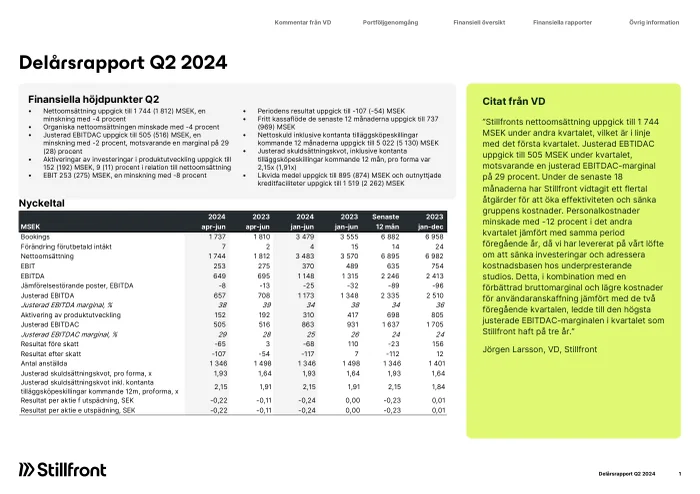
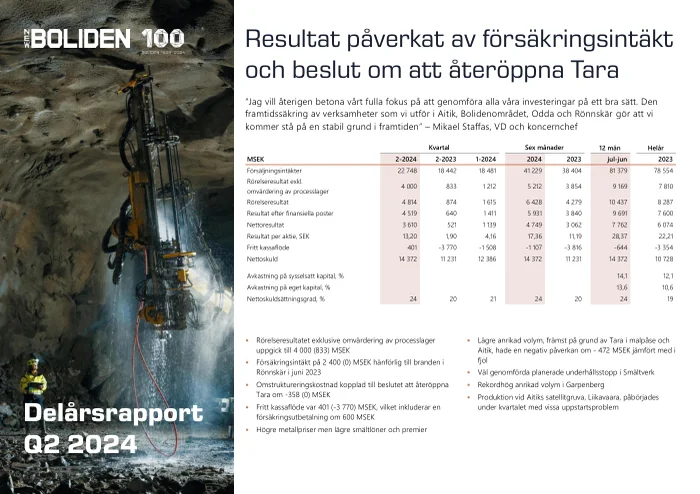
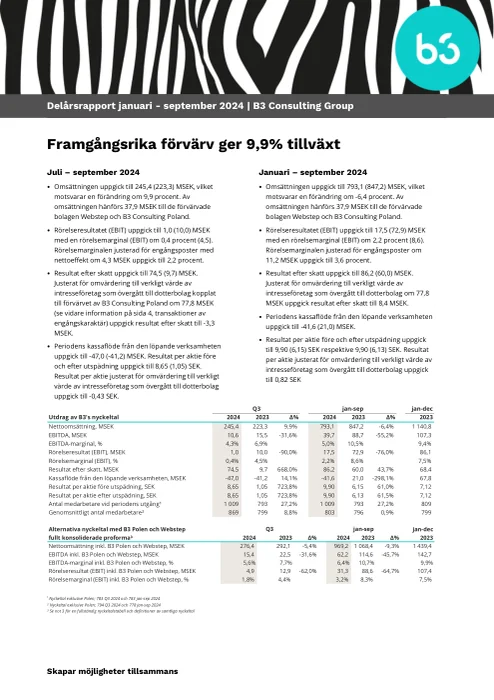
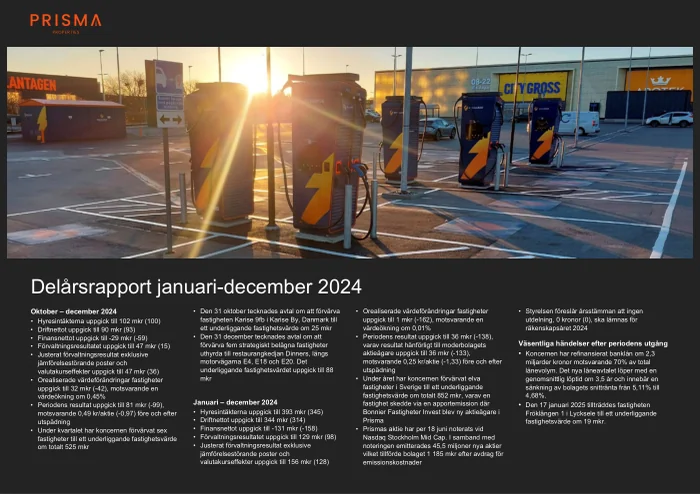
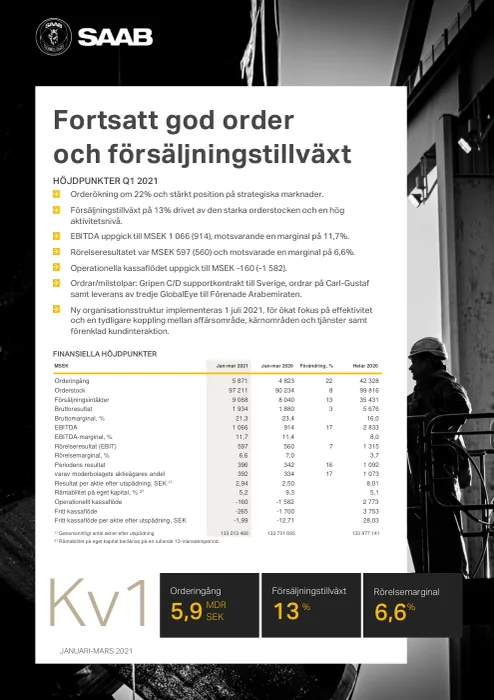
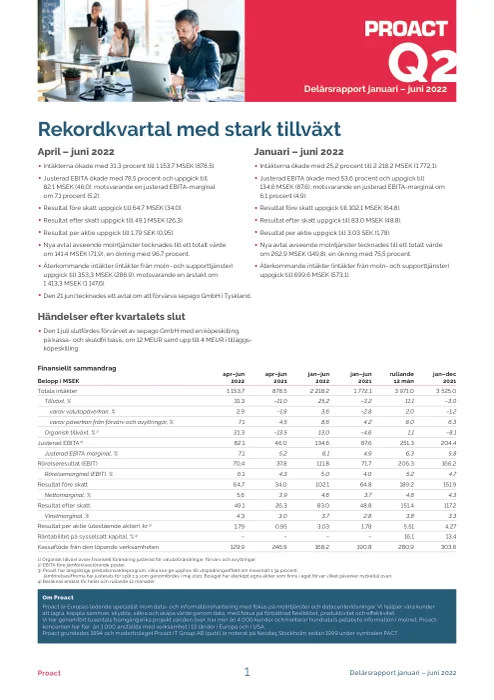
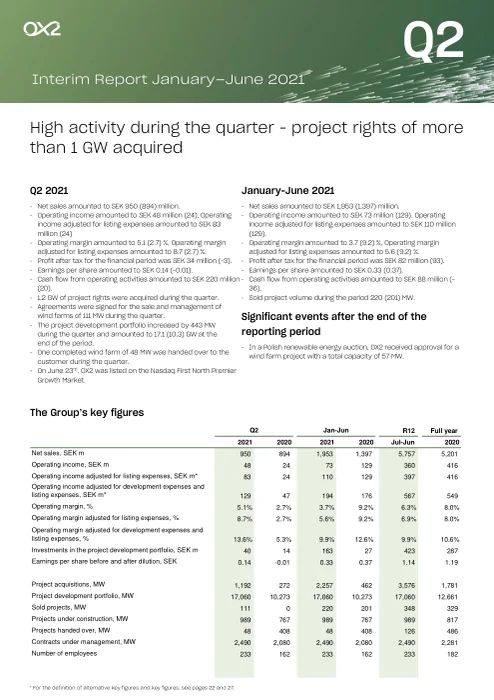
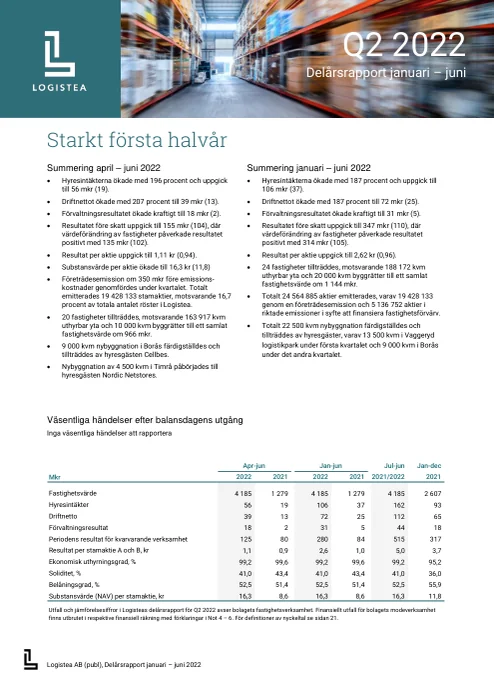
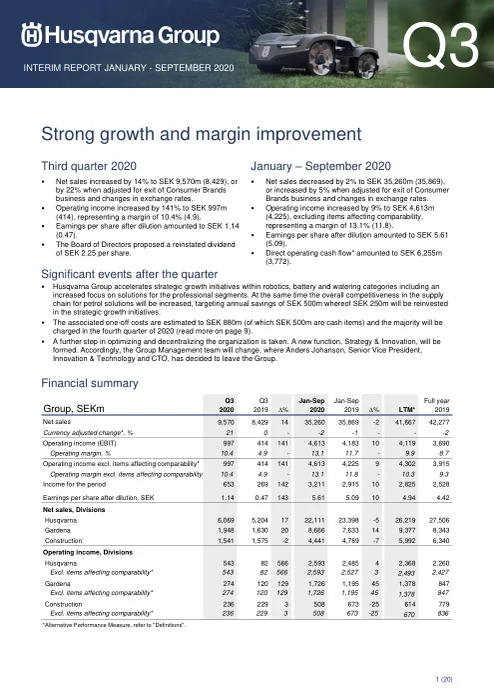
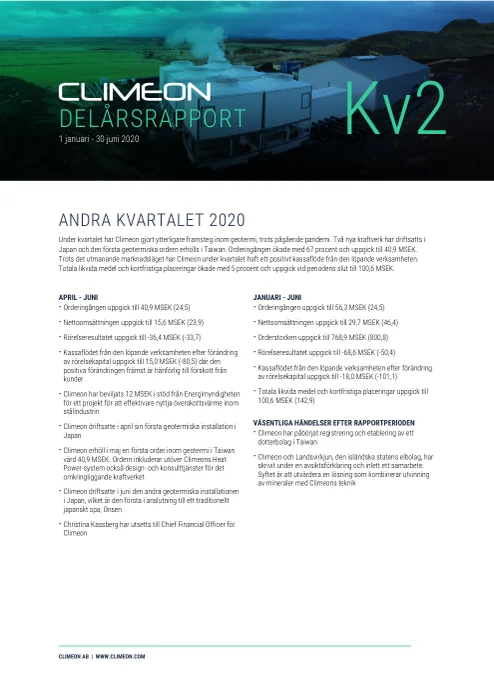
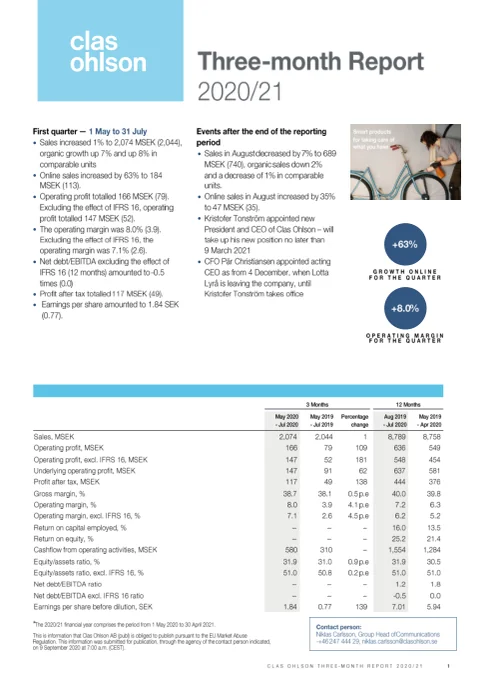
Landscape format with navigation:
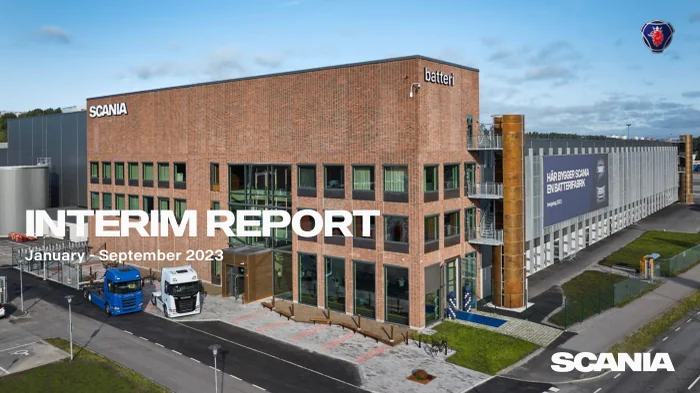
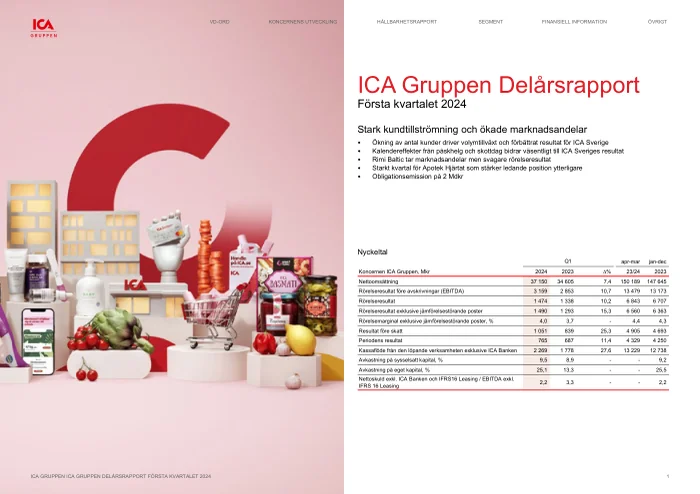
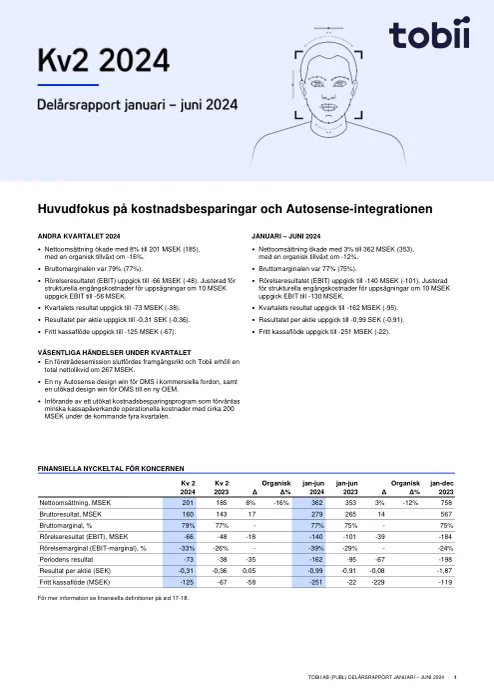
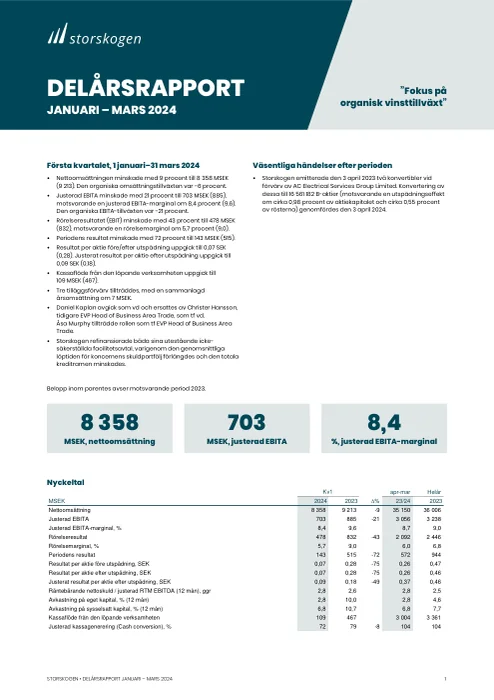
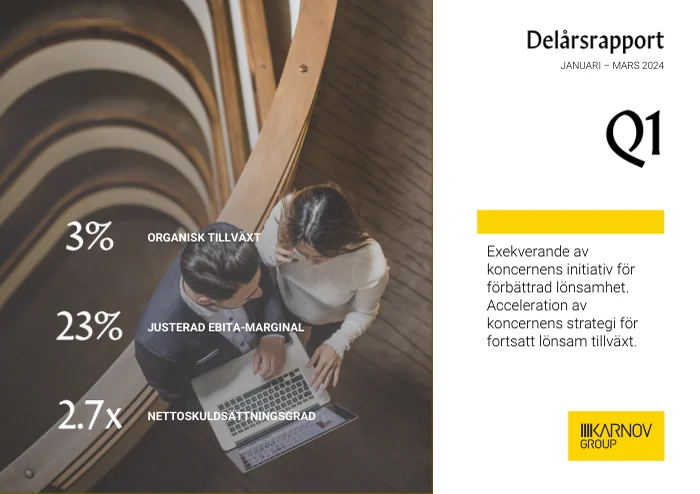
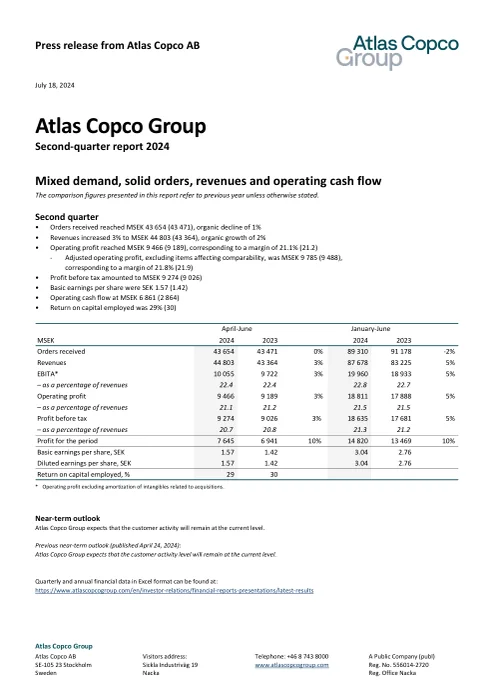
Today, digital reports are prioritized for readability and easy navigation. The 16:9 and landscape A4 formats have their advantages and disadvantages. Landscape A4 is good for printing but does not utilize the entire screen, while 16:9 works well on screen but is less suitable for printing and can be challenging for tables with many rows. Examples of use are at ICA Group and Scania.
Presentations:
We see that people are working more with their presentations and graphic visualization and making the charts in Excel instead of think-cell. Several of our customers choose to minimize manual input by using Excel2PowerPoint to automate the work.
Seeexample
Link to group accounting systems:
Almost all our customers use retrieve formulas in Excel to retrieve data from accounting systems such as AARO, Unit4 FPM, HFM, Cognos and Tiego for efficient interim reporting. Many combine retrieve functionality with automatic historical storage for comparative data.
Segment reporting:
It is becoming more common to expand segment reporting both in scope and with more history.

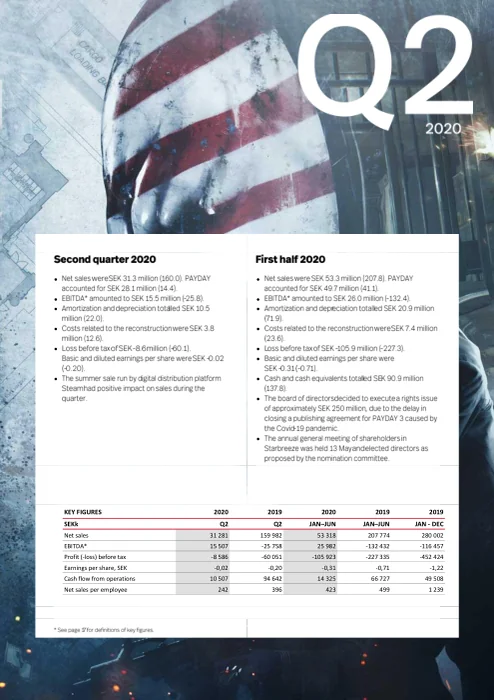
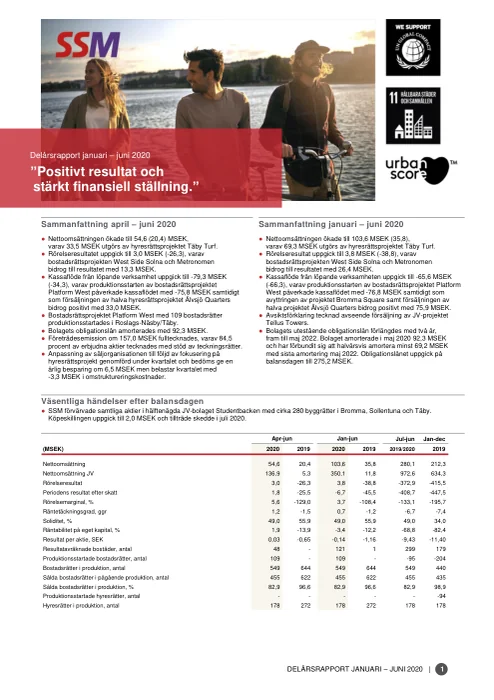
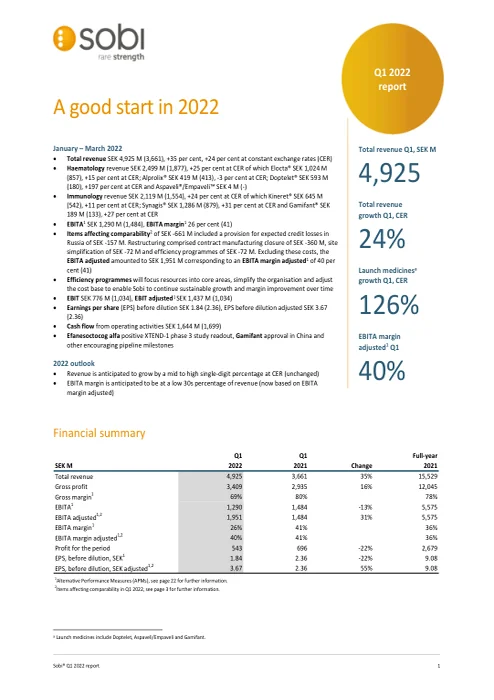
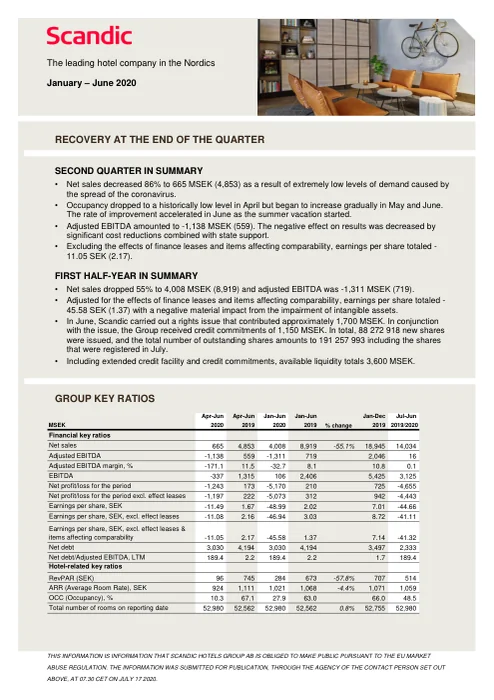
Working on interim reports can be both time-consuming and stressful. Therefore, it is important that you have a functioning work process. With Excel2Word, the process is both smooth and controlled.
Excel2Word connects the data in your interim report to Excel. Your tables and charts in Word are updated automatically. Manually updating the interim report and reviewing changes? Never again!
The QTool allows you to transfer all information from your accounting system (via AARO, Hyperion and Cognos, among others) directly into the report with one click. You can also manage all the tables and charts in the workbook. For example, you can change the quarter and change the language of the text.
Since the work is done directly in Word and Excel, you have full control over both data and text. You don't have to wait for support or contact external parties to make changes. Making changes close to the deadline has never been so hassle-free!


We understand that working with annual reports can sometimes be demanding. That's why we offer flexible solutions - making the process comfortable and smooth for you.
Rehngruppen has a team of experienced Word experts who can offer smart solutions for creating your annual report directly in Word, including its graphic design. Alternatively, we can create a hybrid solution where our efficient solutions are used in the back end, while the front end is done in InDesign. Whichever solution you choose, we ensure support for key features; such as ESEF tagging.
We have developed a number of smart tools that optimize the time spent in the work process. One example is Excel2Word, which allows you to link data from Excel to your annual report. So your tables and charts are automatically updated.
Try our solutions - and find that working on your annual report can be both convenient and easy!


There is no reason whatsoever to start working again after producing your report. Try Excel2PPT. We can ensure that your data is transferred directly and automatically to your presentation.
By linking your tables and charts in PowerPoint to the same data source in Excel that you used for your report, the data in your presentation is always up to date. In addition, all tables and charts are of course nicely designed in your company's color and shape.
A good presentation does not only contain the most important key figures. We can give you the freedom to communicate your messages in an engaging way through an interactive and navigable presentation.

Bring your company's data together in appealing, clear and branded dashboards. With Power BI, your tables and charts become automated, interactive and visually clear.
Free your calendar from the time you spent on monthly data management; such as washing, sorting and formatting. The data transfer to Power BI happens only once. After that, you can focus on creating and sharing business insights based on real-time data.
Power BI is an advanced tool. But with the templates we offer, it's easy to get it right. You get a customized view containing your organization's colors and fonts, visual objects that are adapted to your needs, and a user-friendly menu and navigation.
Did you know that you can create your analyst file with just a click of a button?
The QTool tool allows you to create an auto-generated analyst file from your data in Excel. This saves you precious time while working on your reporting. Moreover, it ensures that the analyst file is not affected by any human errors during its creation.
An autogenerated analyst file with the latest data? Click, done!
Fill in the contact form or call us to book an appointment. We usually respond within a few hours of your request.


See if you can find answers to your questions below, if not, we are happy to help you directly - contact us.
With Rehngruppen's smart tools and templates built in Excel and Word, you can streamline the process. We help you create a basic structure where numbers and texts can be easily updated for new periods, minimizing manual work and saving time. The focus is on automating recurring steps.
Please contact us for a review

