
This is what we do
FAQ

We help you identify, assess, and monitor risks in a way that actually works in your day-to-day operations. In Excel, Power BI, or both, depending on how you work.
We’ll help you create a risk management system that’s easy to use and simple to monitor over time.
We help you identify, assess, and prioritize risks in a clear and organized manner. With a risk matrix and a structured risk analysis, it becomes easier to identify the most critical issues, track progress on actions, and build consensus within the organization.
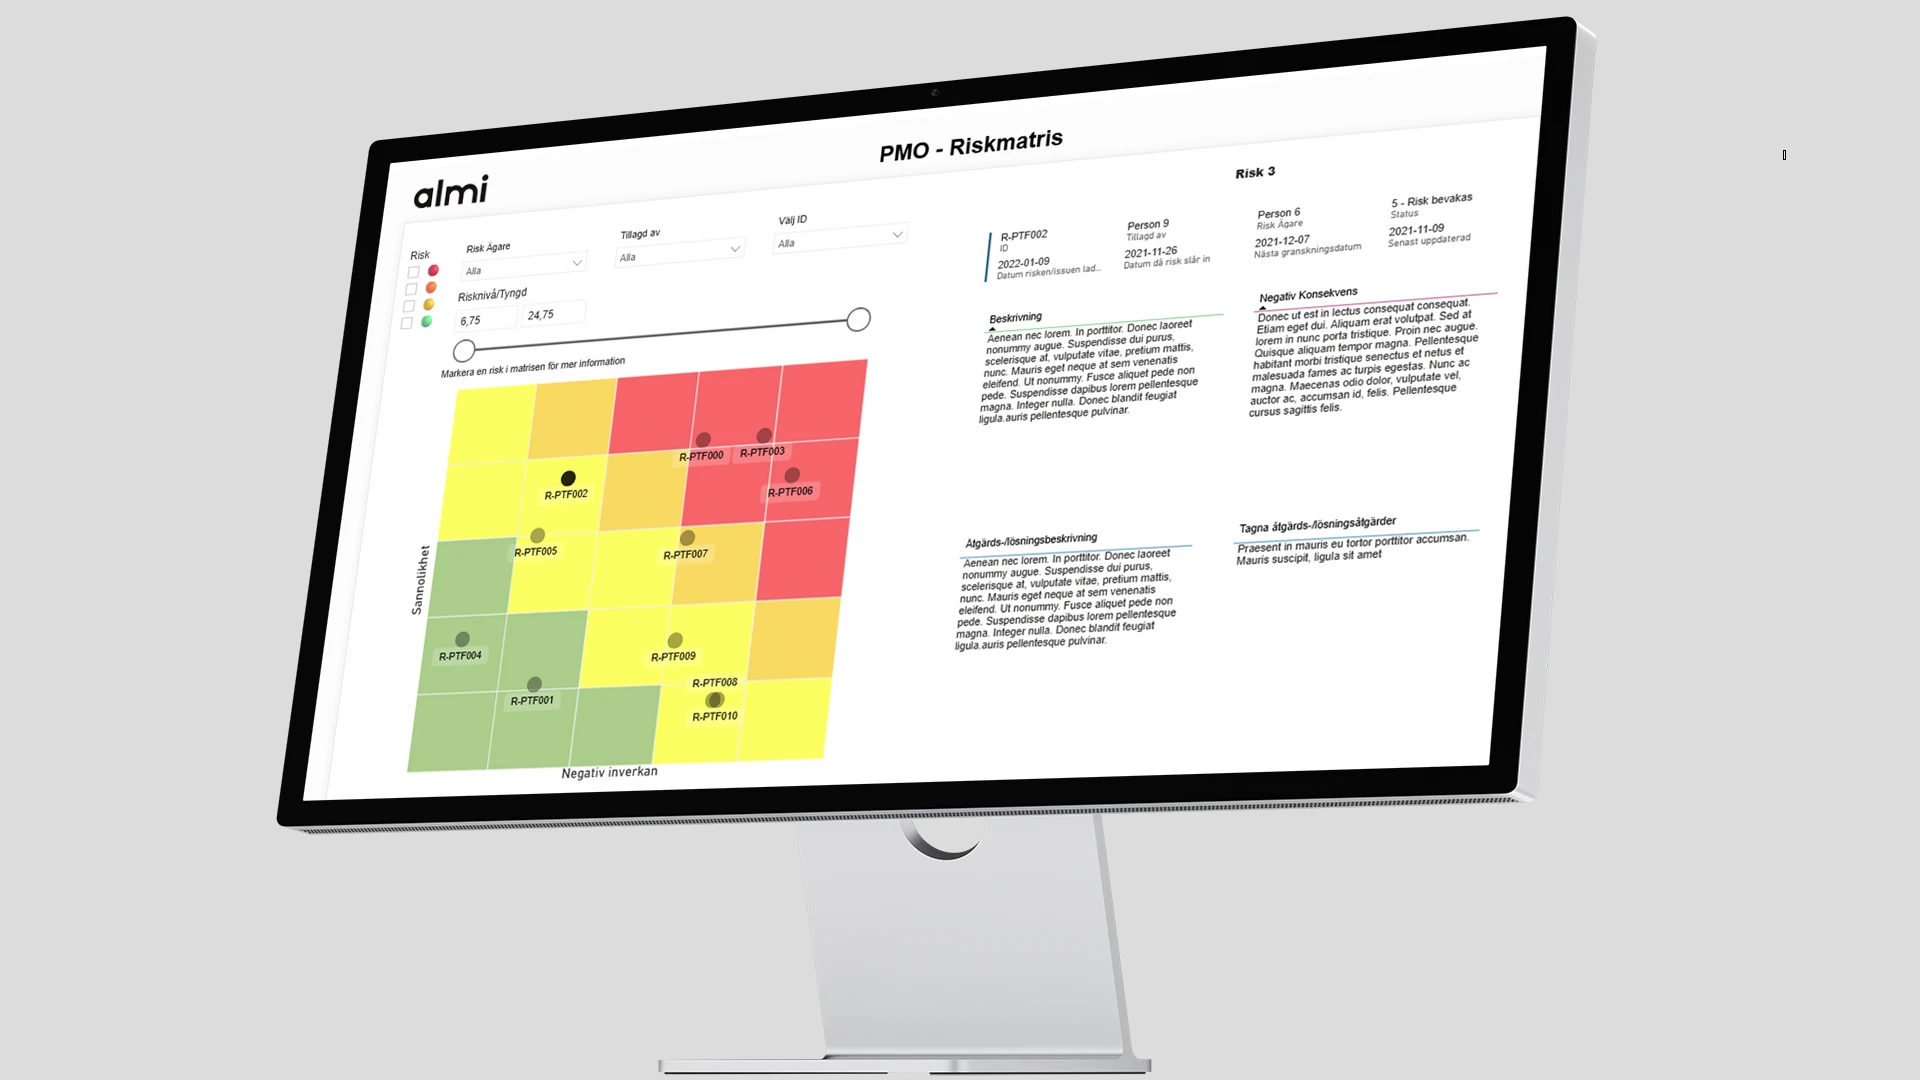
Almi needed a more dynamic and visual way to manage project and risk data. We created an interactive impact & probability matrix in Power BI - a tool that makes it possible to analyze, filter and discuss risks directly in real time.
A risk matrix is a way to prioritize risks by weighing probability against impact. It gives you a clear picture of which risks require immediate action and which ones can be monitored.
When you want to get started quickly, work flexibly, and allow many people to contribute their input. Excel is also great for simpler scenarios, workshops, and when the risk register isn’t very large.
When you want to monitor risks on an ongoing basis, gather data from multiple sources, access interactive views, and ensure a shared understanding across the organization. Perfect for management monitoring and governance.
Yes. In Excel, we can automate tasks using structured tables, data validation, and Power Query. In Power BI, we can connect to data sources and receive scheduled updates, ensuring that the matrix is always up to date.
Yes. You can break down risks by unit, process, project, supplier, or product. In Power BI, this is made especially easy with drill-down features and clickable filters.
Absolutely. We can show trends over time, the status of actions, due dates, and risk levels before and after each action, so you can see the impact and assign responsibility.
Tell us how you manage risks today and what challenges you face. We’ll help you find a solution that fits your business.
Call us on 08-120 233 30 or email us to find out more!
Contact us for more information


