This is what we do
FAQ


Two brands, about twenty markets, and over a thousand items—now everything is consolidated into a single report, with data sourced directly from Visma. The result is a more streamlined and transparent monitoring process that reduces manual work, provides better control over large amounts of information, and creates a clear, comprehensive overview of the business. A solution that makes complex data easy to understand, analyze, and act upon.
Automate your reportsLearn more about our Office templates
Maze is a Scandinavian design company that sells furniture, storage solutions, and lighting through retailers, contract customers, distributors, and its own online store. Sales take place in Sweden and in a large number of export markets. The product line is developed in collaboration with external designers, who receive royalties on sales.
Trade and Services
25
Maze Interior is a Scandinavian design company with two brands, Maze and Pilke. With its furniture, storage solutions, and lighting, the company reaches customers in some twenty markets through retailers, distributors, and its own online store. With a wide range of products, customers, and sales channels, the need for a clearer overview of the company’s finances and sales grew.
Even though all the data was in Visma, the follow-up process relied on manual extracts and Excel. Every month, the income statement was compared to the budget by hand, while calculating royalties for the designers required time-consuming calculations. It was also difficult to get a comprehensive picture of profitability by customer and product. Maze needed a solution that would consolidate the information, reduce manual work, and make the numbers easier to track.
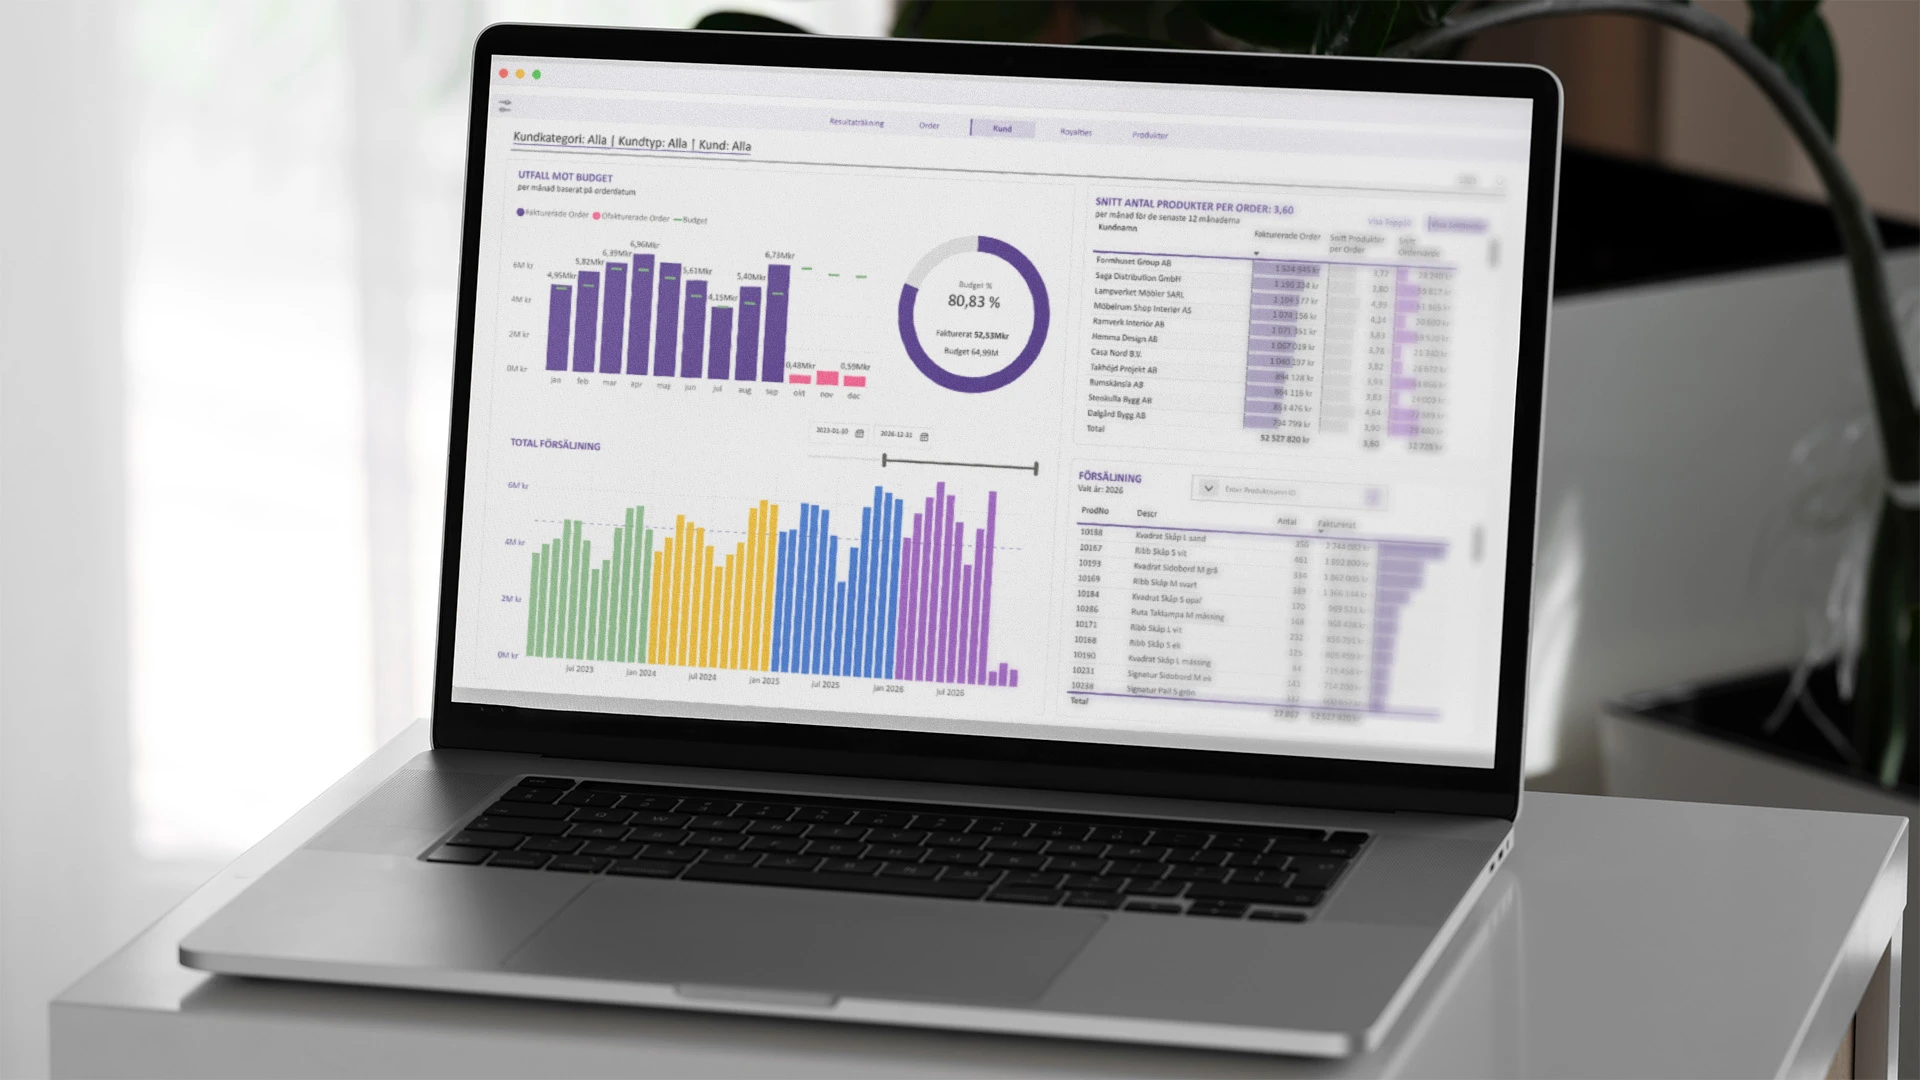
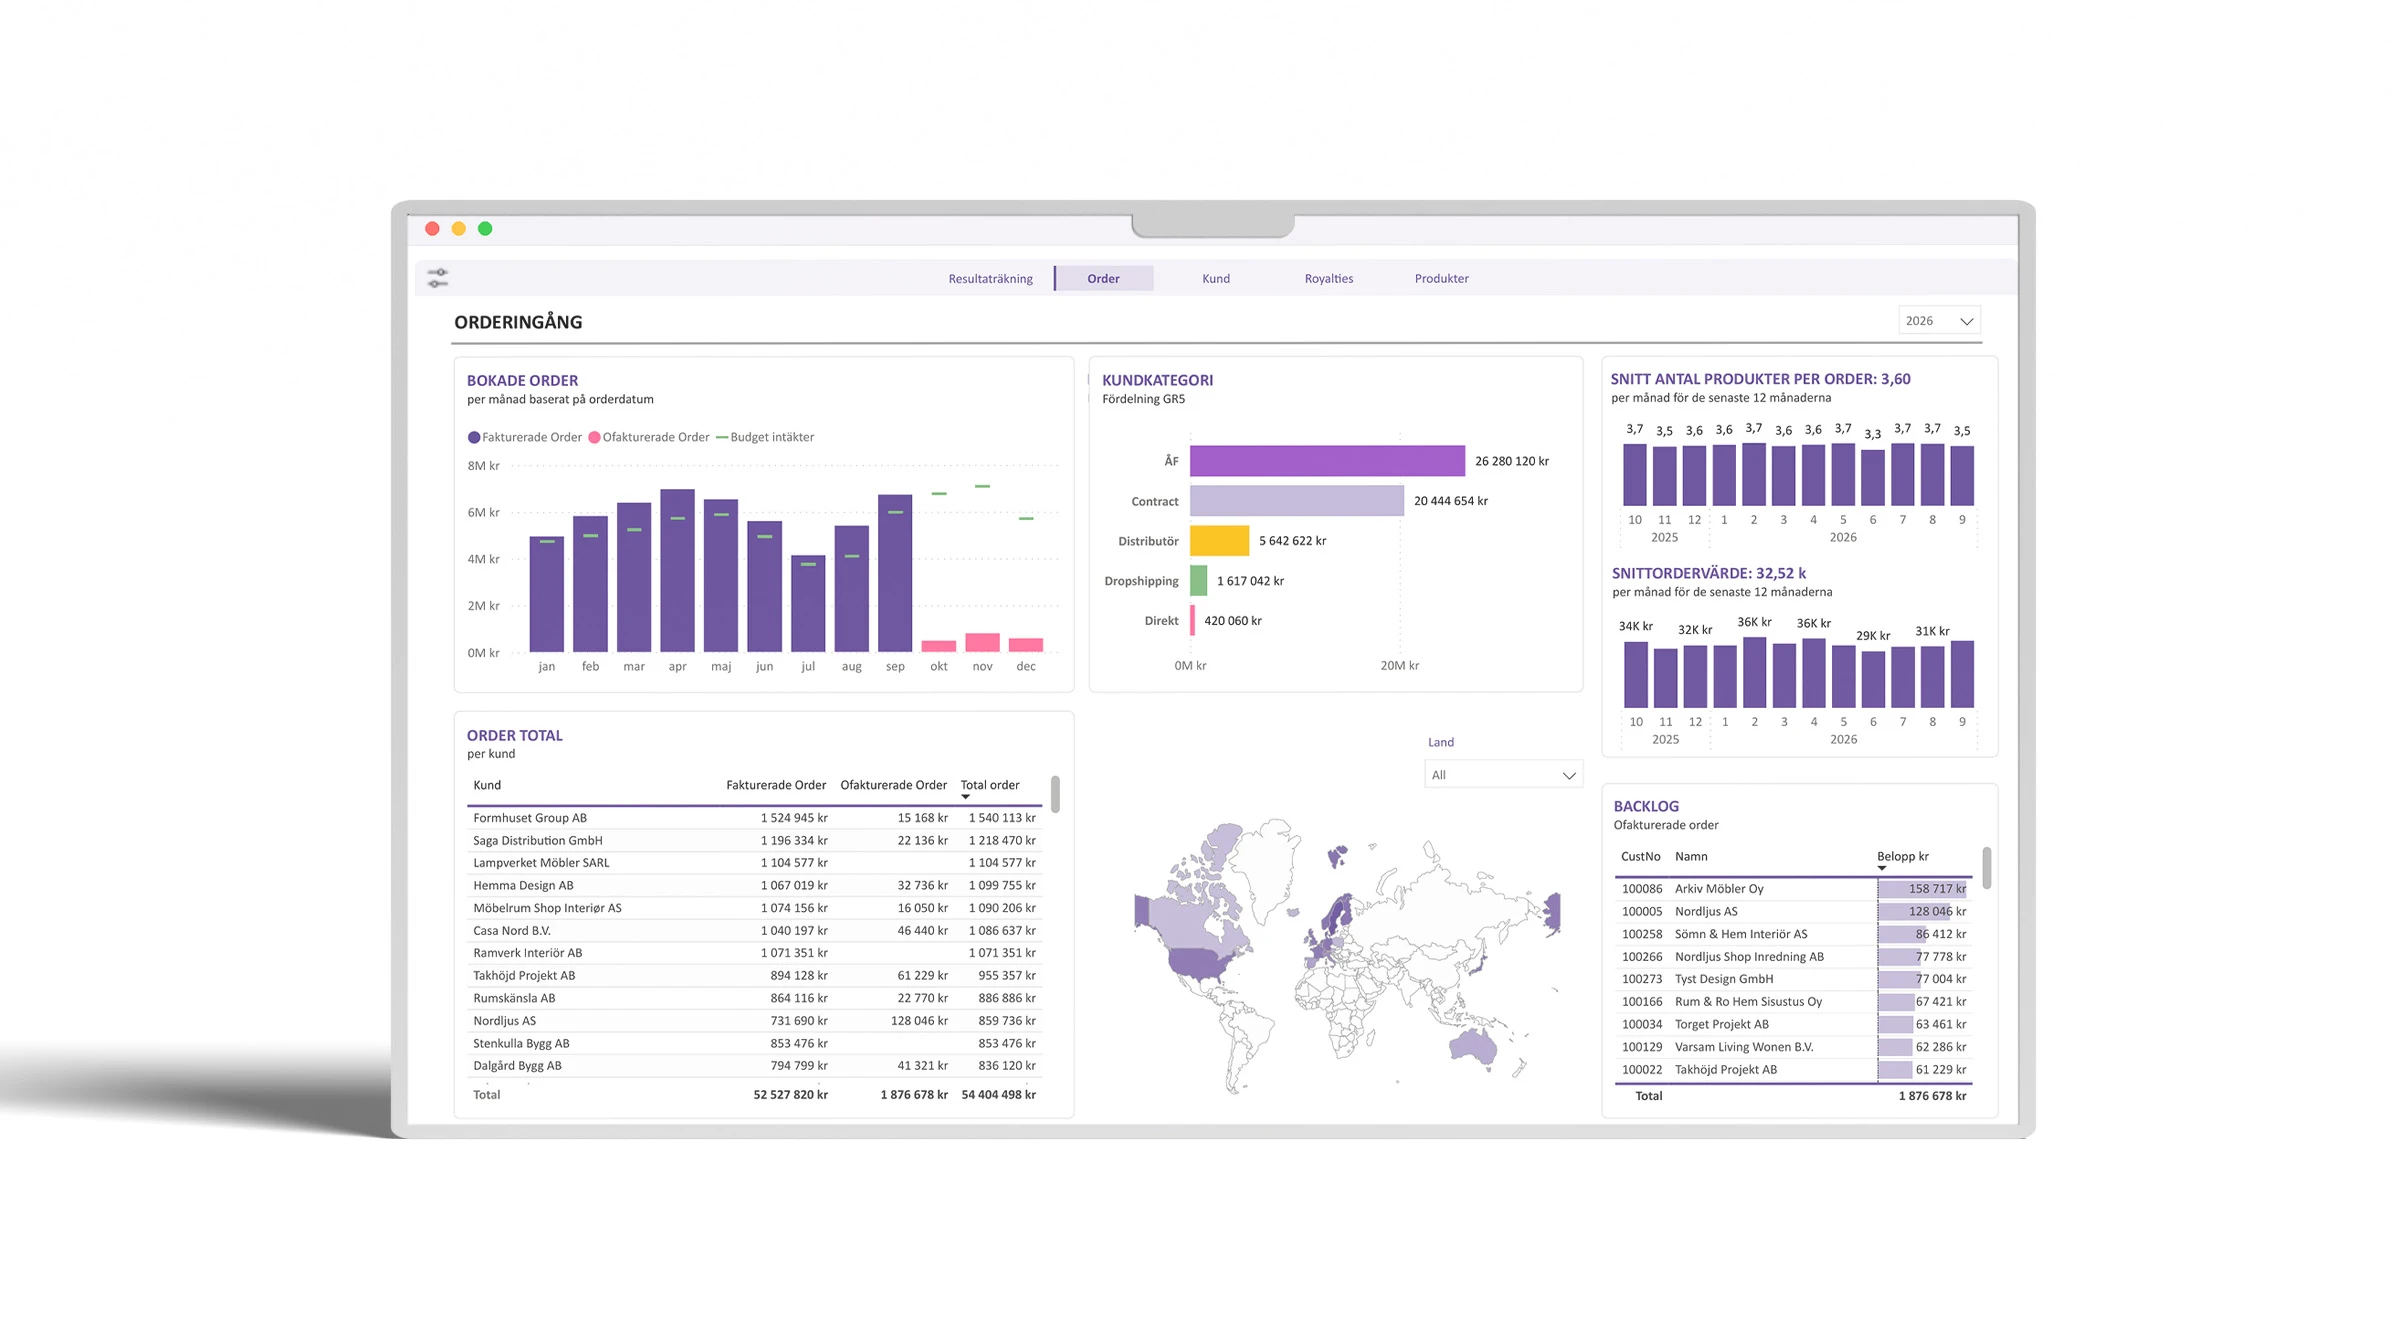
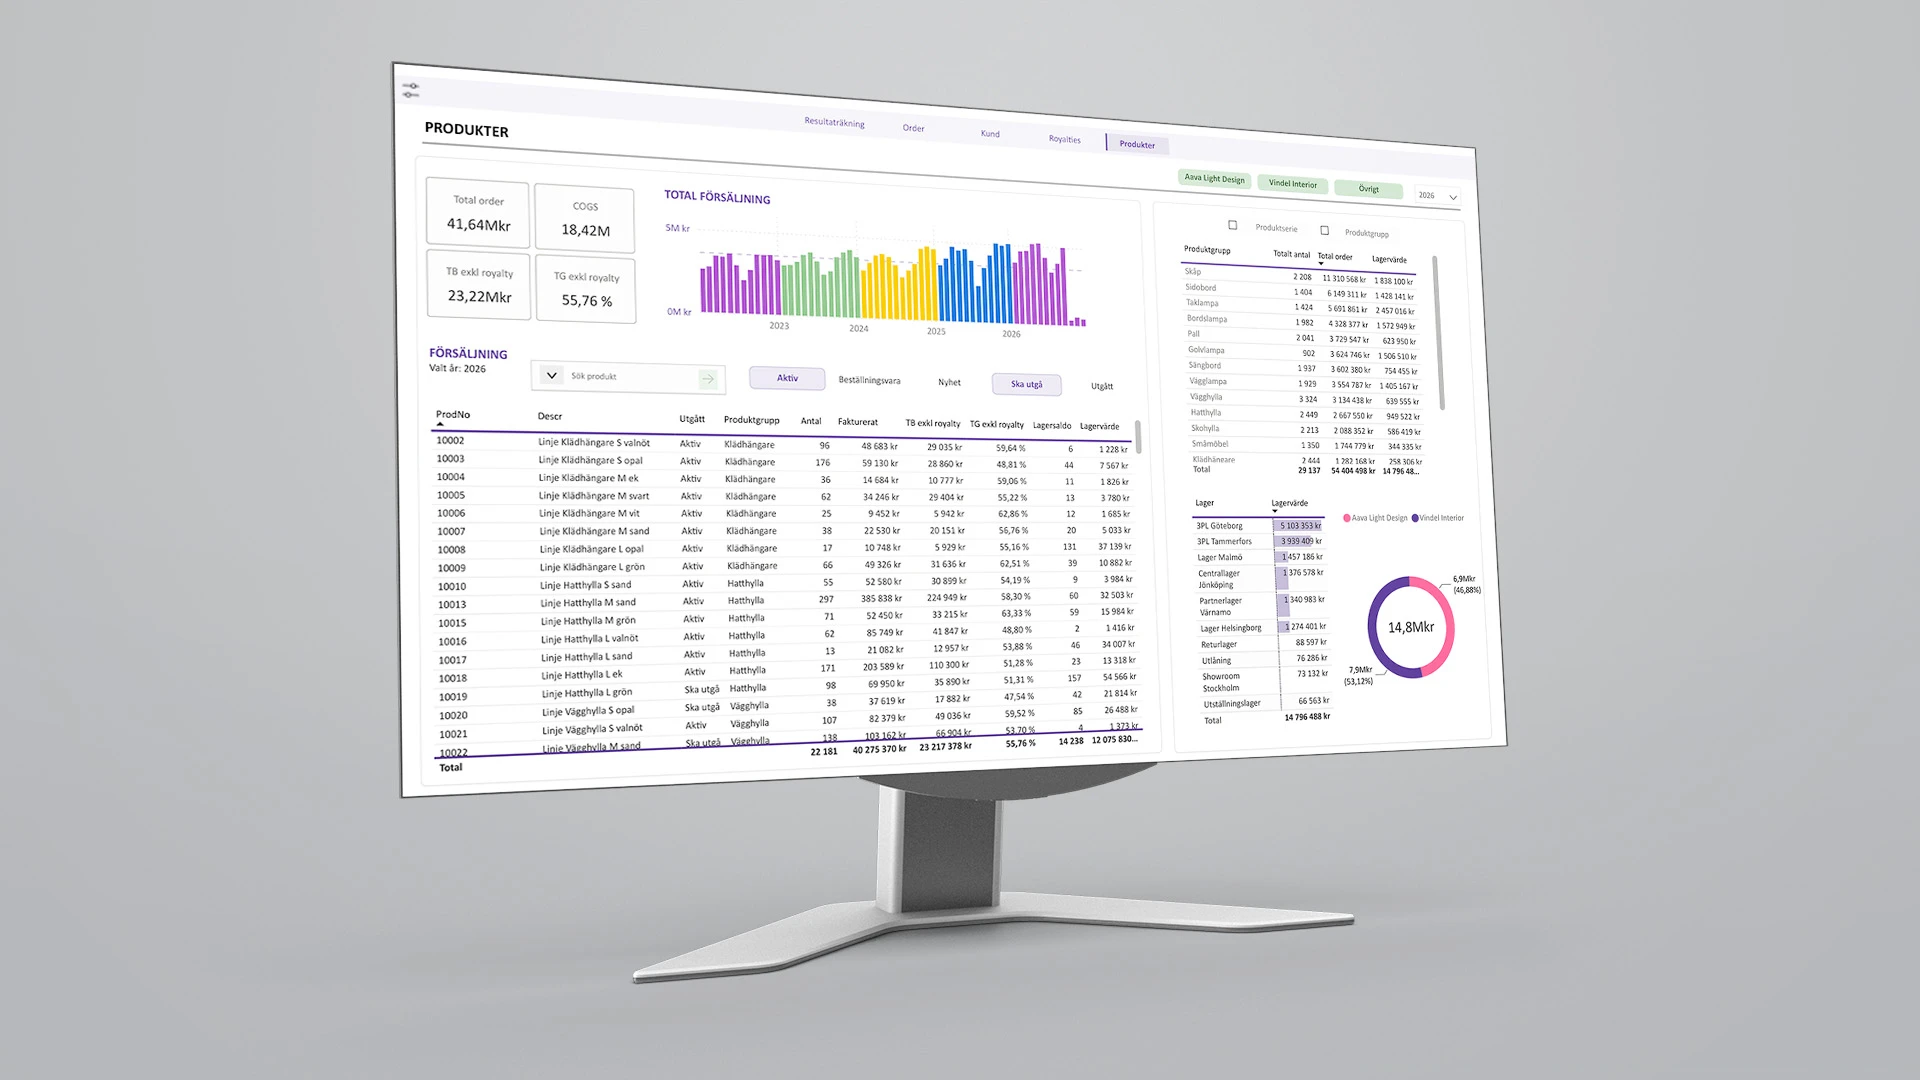
Rehngruppen Developed a Power BI solution where data from Visma is consolidated into a single model and updated automatically. We built an interactive income statement that allows users to track financial performance from overall results down to individual accounts. The solution also provides an overview of order intake, order backlog, key customers, products, and inventory value. Royalties are calculated automatically based on sales, while contribution margins and profit margins can be analyzed by customer, product, and order.

The result is automated reporting that saves time and gives Maze better control over its operations. Royalty data that previously took days to compile is now generated in a matter of minutes, with full traceability to product and market. Management can easily see which customers and products are driving profitability, while finance, sales, and purchasing teams all work from the same data. A flexible solution that makes it easier to make informed decisions and grow in new markets.
Fill out the form or call 08-120 233 30.